December 2013

Are the glory days coming back to Anfield?

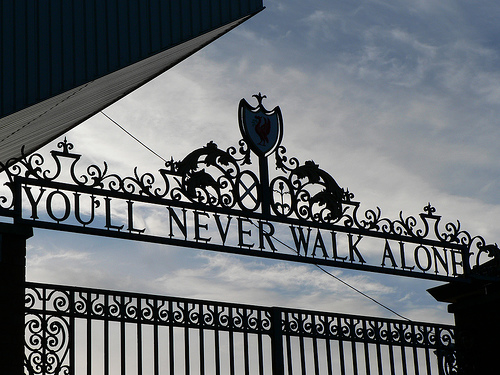
      And the slogan goes ‘you’ll never walk alone’ boldly engraved on the Bill Shankly gate into the well………, I won’t want to say iconic now so I can say historic because it’s got history, talking of the historic stadium of Liverpool FC, Anfield. ‘You’ll never walk alone’ is enshrined in the blood of true and devoted Liverpool fans and it’s got a song which the fans sing before Liverpool takes to the field. Liverpool is by some extent the most successful football team in England. The 70s and 80s period saw Liverpool as one of the most dominant teams in Europe, taking the European Cup (now UEFA Champions League) 4 times and it’s 5th in 2005 as well as 11 league titles during that period. 5 champion’s league titles make Liverpool the highest holder of any team in the British Isle. Liverpool is also a huge success in England because it has 18 league titles to its name. It held that record until Manchester United broke it by winning a record 19th title in 2011 and a further 20th in 2013. It was even at the face of Liverpool that United equaled the tally in 2009 when Liverpool finished 2nd, four points behind United but had a better goal difference and did a double win over United in the league.  Liverpool last won its 18th league title in 1990 during which Manchester United had only 7 league titles to their name. The era under the guidance of Sir Alex Ferguson ensured Liverpool’s league dominance came to a halt while Manchester United took 13 league titles between 1993 and 2013. It can be considered a shame that Liverpool hasn’t had a league title for 23 years and you might ask when is the League especially the new format premier league which began in 1993 going to come back to Anfield? Well you be the Judge of that. The only way to say the league is coming back to Anfield is by looking at each season and it’s not news that Liverpool’s last few seasons in the league have been dismal. Not making it to Europe last season, a four year absence from the champions league and cross town rivals Everton finishing above them in the league.             So how has Liverpool done so far this season? Let’s now have a look. Firstly Liverpool is not in Europe this season so they are focusing barely on the league and domestic competitions. Well Liverpool started the season without talisman Luis Suarez who continued a 10 match ban for biting Branislav Ivanovic last season. Liverpool kicked off the season well. Taking 3 1-0 victories including against Manchester United. Then a draw against Brendan Rogers former team Swansea City followed. The next fixture against Southampton would be their 1st loss of the season and it was at Anfield. People may have started deducing that Liverpool will have another bad season and without Suarez back more trouble was coming. But let’s not forget that in Suarez’s absence, Daniel Sturridge was delivering the goals. Liverpool fans must have been eager for Suarez to return to action and it did eventually come in the Capital One Cup tie against Manchester United. He could not muster a win for Liverpool as they lost 1-0 at Old Trafford. Liverpool was now out of a domestic cup and won’t play in the FA Cup until January. So it’s the league all to play for now. Suarez made his league comeback against Sunderland at the Stadium of Light and it was a grand return. A brace by Suarez and a 3rd by Sturridge made sure Liverpool took a 3-1 win. How everyone was happy to see Suarez back. The disappointment of the loss to Southampton had been put behind as Liverpool secured 2 further wins and a draw against Newcastle United. Liverpool had been in the top 2 all this time and it was time to face table toppers Arsenal. All didn’t go well and the Suarez-Sturridge combo couldn’t do anything as Liverpool fell 2-0. Liverpool fans didn’t need to worry about that loss because more positive results were coming aided by that man Suarez. A victory against Fulham followed and a goal-fest 3-3 draw against cross town rivals Everton followed and another bad day in the office made Liverpool take a 3-1 loss to league returnees Hull City. The next fixtures saw Liverpool burst the goals out and with no loss this time. Wins against Norwich, West ham, just last week Tottenham and today Cardiff City  have seen Liverpool scored 17 goals in the 4 fixtures and  who’d be the architect of it all if not Suarez. His return has seen him net 19 league goals in just 12 matches. The highlight been the match against Norwich where he bagged 4 goals and in the process became the 1st EPL player to score 3 hat tricks against the same team.             The efforts of Suarez have seen Liverpool score 41 goals in the league, 28 of those coming from both Suarez and Sturridge. The 19 goals scored by Suarez is more than 10 premier league teams have managed to score so far this season. Liverpool is now top of the table with 35 points at least till Monday when Arsenal takes on Chelsea. Liverpool haven’t scored this many league goals at this point since 1988 in which they were league champions. Liverpool also seems to have gelled with the passing philosophy of Rogers. The hot form of Suarez has seen him outpace Real Madrid’s goal machine Cristiano Ronaldo and Diego Costa of Atletico Madrid to be Europe’s current top goal scorer. Suarez’s current form suggests that if he stays fit and out of trouble this season , he could score over 40 EPL goals which will be a record and contention for the European Golden Boot. Liverpool not playing in Europe this season gives the team concentration on the league. With the other teams in European commitments, Liverpool will

Are the glory days coming back to Anfield? Read More »

Year 2013 in men’s tennis: stats

       The year 2013 in men’s tennis was a remarkable one. As usual it was dominated by the big 4 or rather do we say big 3. Big 3 because a member of the original big 4 has dropped in performance and only managed only one title all year and that person: Roger Federer. Federer who is arguably the greatest male tennis player in the open era saw 2013 as his worse year to date in his career. He failed to make the final of a grand slam talk less of winning and his record of consecutive grand slam quarter final appearances came to end after he went of Wimbledon, where he has 7 titles to his name in the 2nd round. His performances have dropped so dramatically, it’s like a miracle if he can pull through a game he should win easily. He has been beaten by players ranked hundreds of places below him and it seems there is no way of coming back for him. After all, he has reached his peak aged 32. We can therefore now recognise a big 3 which dominated the year. The three in Rafael Nadal, Novak Djokovic and Andy Murray. The one who stole the headlines was undoubtedly Nadal who came back this year after an injury affected 2012. He came back better than he has been in his career and swept most of the tournaments he played. Those wins were able to help him reclaim the no.1 player from Djokovic, who had a great year but compared to Nadal. Then Andy Murray had a great year, winning Wimbledon and becoming the first Brit to do so in over 70 years. Other players like Juan Martin del Potro, Veteran David Ferrer also had a great year. These are a few stat highlights to the 2013 men’s tennis.   Grand Slam finals Australian Open: Novak Djokovic beat Andy Murray 6-7, 7-6, 6-3, 6-2 French Open: Rafael Nadal beat David Ferrer 6-3, 6-2, 6-3 Wimbledon: Murray beat Djokovic 6-4, 7-5, 6-4 US Open: Nadal beat Djokovic 6-2, 3-6, 6-4, 6-1   Masters 1000 tournament winners Indian Wells: Rafael Nadal Miami: Andy Murray           Monte Carlo: Novak Djokovic Madrid: Rafael Nadal Rome: Rafael Nadal Montreal: Rafael Nadal Cincinnati: Rafael Nadal Shanghai: Novak Djokovic Paris: Novak Djokovic   Titles in 2013 Rafael Nadal – 10 Novak Djokovic – 6 Andy Murray – 4 Juan Martín del Potro – 4 Richard Gasquet – 3   Youngest Finals Brisbane: Andy Murray (25) vs. Grigor Dimitrov (21) Sydney: Bernard Tomic (20) vs. beat Kevin Anderson (26)   Oldest Finals Munich: Tommy Haas (35) vs. Philipp Kohlschreiber (29) Bogota: Ivo Karlovic (34) vs. beat Alejandro Falla (29)   Over 30 Winners – 16 (most since 1975) David Ferrer – Auckland 30 years, 9 months David Ferrer – Buenos Aires 30 years, 10 months Tommy Robredo – Casablanca 30 years, 11 months Tommy Haas – Munich 35 years, 1 month Albert Montanes – Nice 32 years, 6 months Roger Federer – Halle 31 years, 10 months Feliciano Lopez – Eastbourne 31 years, 9 months Nicolas Mahut– Hertogenbosch 31 years, 5 months Nicolas Mahut – Newport 31 years, 5 months Carlos Berlocq – Bastad 30 years, 5 months Ivo Karlovic – Bogota 34 years, 4 months Mikhail Youzhny – Gstaad 31 years, 1 month Tommy Robredo – Umag 31 years, 2 months Jurgen Melzer – Winston-Salem 32 years, 3 months Tommy Haas – Vienna 35 years, 6 months Mikhail Youzhny – Valencia 31 years, 4 months   Longest Winning Streaks Player – Matches – Duration Novak Djokovic – 22 – September 13-November 11 Rafael Nadal – 22 – April 22-June 24 Rafael Nadal – 22 – August 5-October 6 Rafael Nadal – 18 – February 11-April 21 Novak Djokovic – 17 (22 back to 2012) – January 14-March 16 Fabio Fognini – 13 – July 8-July 28 Andy Murray – 13 – June 10-August 8 Andy Murray – 10 – January 1-January 27   Titles won without losing a set (9) Player – Tournament Milos Raonic – San Jose Juan Martin Del Potro – Rotterdam Kei Nishikori – Memphis Novak Djokovic – Dubai Rafael Nadal – Acapulco Rafael Nadal – Barcelona Albert Montanes – Nice Nicolas Mahut– Hertogenbosch Gilles Simon – Metz   Most aces served John Isner – 979 Milos Raonic – 883 Kevin Anderson – 651 Source: Eurosport

Year 2013 in men’s tennis: stats Read More »

Nelson Rolihlahla Mandela a.k.a Madiba: A Sports Life

            Nelson Mandela’s life and the impacts he made are of course common knowledge. A little less renowned, however, is the true extent of his involvement in sporting events and public relations over the years. While his appearances at the conclusion of South Africa‘s World Cups in 1995 (rugby union) and 2010 (football) are as legendary as his political journeys, Mandela wined and dined with sporting icons across a host of events and disciplines all around the globe. This is a pick of 10 great Nelson Mandela sporting moments. RIP Nelson Mandela, 1918-2013                                                                                                      1993: Mandela poses with Manchester United ahead of their friendly contest with Kaizer Chiefs 1993: Shaking hands with Tony Adams before Arsenal’s FA Cup quarter-final against Newcastle 1995: Presenting the Webb Ellis trophy to South African skipper Francois Pienaar after a successful home World Cup effort 1995: Meeting with football icon Pele to discuss plans for a Brazil v South Africa exhibition match 2000: Talking to members of the Tanzania Olympic contingent during a pre-Sydney Games tour of Australia 2001: ‘Marvelous’ Marvin Hagler ‘holds back’ fellow boxer Lennox Lewis and Madiba. 2002: With then-South African cricket captain Shaun Pollock 2005: Pienaar and Lucas Radebe with Nelson at the Mandela Challenge Plate at Ellis Park Stadium, a decade on from South Africa’s Rubgy World Cup win. 2008: Sharing a joke with South Africa’s medal-winning Paralympians after the Beijing Games 2010: Taking to the pitch before Spain defeated the Netherlands in the World Cup final Source: Eurosport

Nelson Rolihlahla Mandela a.k.a Madiba: A Sports Life Read More »

The 2014 World Cup: Teams Stats Part 3

TEAM-BY-TEAM SUMMARIES FIFA ranking points are given with their position in brackets e.g. England 1041 (13) means that England have 1041 ranking points and are ranked 13th in the World. Algeria                                                                  FIFA ranking: 800 (26) from 907 (19) one year ago 1 of 7 teams to score in every qualifying match Scored the largest proportion of goals from long balls: 19% Argentina FIFA ranking: 1251 (3) from 1349 (3) one year ago Scored the largest proportion of goals created from central positions: 77% Kept the smallest proportion of clean sheets: 25% Australia FIFA ranking: 564 (59) from 719 (33) one year ago – 3rd biggest fallers of the 32 finalists and the lowest-ranked side in the tournament Conceded the 2nd largest proportion of goals from counter attacks: 25% Scored the 2nd highest proportion of goals in the final 15 minutes of matches: 52% Belgium FIFA ranking: 1098 (11) from 881 (20) one year ago – 3rd most improved of the 32 finalists 1 of 7 teams to score in every qualifying match Conceded the largest proportion of goals created from the wings: 75% 1 of 6 teams not to have conceded more than once in a match   Bosnia FIFA ranking: 886 (21) from 881 (20) one year ago 1 of 6 teams not to have conceded more than once in a match 1 of 4 teams not to have dropped any points from winning positions Scored 3 or more goals in the 2nd largest proportion of matches: 60% Brazil FIFA ranking: 1102 (10) from 994 (13) one year ago Conceded the 2nd largest proportion of goals from outside the area: 47% Scored 2 or more goals in the 3rd highest proportion of matches: 84$ Cameroon FIFA ranking: 612 (51) from 520 (61) one year ago Scored the 3rd fewest goals per match: 1.29 Conceded the highest proportion of goals from corners: 50% Chile FIFA ranking: 1014 (15) from 853 (21) one year ago – 4th most improved of the 32 finalists 3rd largest proportion of goals from inside the 6 yard box: 43% Conceded the most goals per match: 1.56 Colombia FIFA ranking: 1200 (4) from 1110 (8) one year ago Scored the 2nd smallest proportion of goals from headers: 4% 1 of 3 teams not to score from a corner Costa Rica FIFA ranking: 738 (31) from 509 (64) one year ago – 2nd most improved of the 32 finalists Failed to score in the 2nd highest proportion of matches: 31% Scored the 4th highest proportion of headed goals: 33% Croatia FIFA ranking: 971 (16) from 1078 (10) one year ago Largest proportion of goals from inside the 6 yard box: 43% 1 of 2 teams not to score more than twice in any matches Scored the fewest goals per match: 1.17 Ecuador FIFA ranking: 852 (23) from 951 (17) one year ago Scored the largest proportion of goals from headers: 45% Scored the 2nd fewest goals per match: 1.25 England FIFA ranking: 1041 (13) from 1167 (6) one year ago – 5th biggest fallers of the 32 finalists 1 of 6 teams not to have conceded more than once in a match Scored the 6th highest proportion of goals from outside the box: 19% Conceded the highest proportion of goals from corners: 50% France FIFA ranking: 893 (19) from 938 (18) one year ago Scored the 3rd largest proportion of goals from outside the area: 24% Failed to score in the 3rd highest proportion of matches: 30% Germany FIFA ranking: 1318 (2) from 1421 (2) one year ago 1 of 2 teams to score at least 2 goals in every match Scored the 3rd largest proportion of goals created from central positions: 69% Scored the most goals per match: 3.60 Ghana FIFA ranking: 849 (24) from 762 (29) one year ago Scored the 3rd most goals per match: 3.13 Scored the 4th largest proportion of goals from inside the 6 yard box: 36% Greece FIFA ranking: 1055 (12) from 1004 (12) one year ago 1 of 4 teams not to have conceded a goal from outside the penalty area 1 of 3 teams not to score from a corner Honduras FIFA ranking: 688 (41) from 572 (56) one year ago Failed to score in the highest proportion of matches: 38% Conceded the 6th lowest proportion of goals down their left flank: 13% Iran FIFA ranking: 650 (45) from 611 (44) one year ago 1 of 4 teams not to have conceded a goal from outside the penalty area Scored the highest proportion of goals from set pieces: 40% Conceded the highest proportion of goals from set pieces: 57% Conceded the highest proportion of goals from inside the 6 yard box: 57% Italy FIFA ranking: 1120 (7) from 1169 (5) one year ago Scored the 2nd largest proportion of goals from headers: 42% Scored the 4th lowest proportion of goals from outside the penalty area: 5% Ivory Coast FIFA ranking: 918 (17) from 974 (15) one year ago 1 of 7 teams to score in every qualifying match Scored the largest proportion of goals in the first 15 minutes of matches: 26% Japan FIFA ranking: 638 (48) from 810 (24) one year ago – 2nd biggest fallers of the 32 finalists Scored the 4th lowest proportion of goals in the first 15 minutes of matches: 7% Scored the 7th highest proportion of headed goals: 30% Mexico FIFA ranking: 892 (20) from 984 (14) one year ago Conceded the 5th lowest proportion of goals from outside the area: 7% Scored the 4th highest proportion of goals in the final 15 minutes of matches: 35% Netherlands FIFA ranking: 1106 (9) from 1128 (7) one year ago 1 of 2 teams to score at least 2 goals in every match Scored the 2nd largest proportion of goals from outside the area: 24% Conceded the 3rd largest proportion of goals from outside the area: 40% Scored the 3rd most goals per match: 3.40 Nigeria FIFA ranking: 710 (36) from 553 (57)

The 2014 World Cup: Teams Stats Part 3 Read More »

The 2014 World Cup: Teams Stats Part 2

TOP AND BOTTOM THREES Here are some rankings of the best and worst teams across a range of goalscoring and conceding measures. Goal scoring rates Highest goals scored per match: Germany 3.60 Netherlands 3.40 Ghana 3.13 Lowest goals scored per match: Croatia 1.17 Ecuador 1.25 Cameroon 1.29 Highest goals conceded per match: Chile 1.56 Uruguay 1.39 Ecuador & Germany 1.00 Lowest goals conceded per match: Spain 0.38 Belgium & England 0.4 Close range goals Highest proportion of goals scored from inside the 6 yard box: Croatia 43% USA 38% Chile 38% Lowest proportion of goals scored from inside the 6 yard box: Russia 5% France 6% Argentina 9% Highest proportion of goals conceded from inside the 6 yard box: Iran 57% Croatia 56% Bosnia 50% Lowest proportion of goals conceded from inside the 6 yard box: Belgium, Netherlands, Nigeria & Spain (all 0%) Long range goals Highest proportion of goals scored from outside the penalty area: Nigeria 36% Netherlands 24% Cameroon & France 22% Lowest proportion of goals scored from outside the penalty area: Spain 0% Portugal 4% Ecuador 5% Highest proportion of goals conceded from outside the penalty area: Nigeria 50% Brazil 47% Netherlands 40% Lowest proportion of goals conceded from outside the penalty area: Greece, Iran, Russia & Spain (all 0%) Headed goals Highest proportion of goals scored from headers: Ecuador 45% Italy 42% Australia 36% Lowest proportion of goals scored from headers: Germany 0% Colombia 4% Argentina 6% Highest proportion of goals conceded from headers: Russia 60% Cameroon & Greece 50% Lowest proportion of goals conceded from headers: Australia, Belgium, Bosnia, Ghana, Netherlands, Nigeria 0% Set piece goals Highest proportion of goals scored from set pieces: Iran 40% Nigeria 36% Portugal & Uruguay 33% Lowest proportion of goals scored from set pieces: Germany 3% Argentina 9% Greece 13% Highest proportion of goals conceded from set pieces: Iran 57% South Korea 55% Cameroon, England, Greece 6% Lowest proportion of goals conceded from set pieces: Netherlands & Spain 0% Australia 8% Goals from the wings Highest proportion of goals scored from the wings: Croatia 64% Belgium 61% Australia 56% Lowest proportion of goals scored from the wings: Argentina 11% Colombia & Germany 22% Highest proportion of goals conceded from the wings: Belgium 75% Algeria 71% Italy 67% Lowest proportion of goals conceded from the wings: Spain 0% Netherlands 20% Chile 24% Points won Highest proportion of points taken from winning positions: Bosnia, Cameroon, France, Ghana 100% Lowest proportion of points taken from winning positions: Chile 78% Uruguay 82% USA 81% Highest proportion of points taken from losing positions: Germany & Spain 100% (Germany only in one losing position and Spain never were) Bosnia 67% Lowest proportion of points taken from losing positions: Cameroon, Chile, Ghana, Mexico, Russia 0% Source: The Press Association.

The 2014 World Cup: Teams Stats Part 2 Read More »

The 2014 World Cup: Teams Stats

Now that the World Cup draw has been made we can really start to look forward to next summer’s festival of football. These stats have been available by The Press Association who have analysed all the goals scored and conceded by the 32 World Cup finalists across the 352 qualifying matches they collectively played (including all of Brazil’s internationals in 2013, which were added in place of them needing to qualify). The stat pack section lists head-to-head stats for the teams drawn into each group, either where one team’s strength aligns to an opponent’s weakness or where a strength is cancelled out by that of an opponent. There is also a second section which lists the top and bottom three ranked nations for a range of stat types. And finally there’s a section giving some information for each of the 32 teams, including their biggest strengths and weaknesses and their FIFA Ranking. The idea behind these stats is that it gives one a closer insight into how each of the 32 teams will perform in the World Cup based on their performances in the qualifiers. HEAD-TO-HEAD STATS                                                      Group A – Brazil, Cameroon, Mexico, Croatia Cameroon scored 22% (3) of their goals from outside the penalty area, while Brazil conceded 47% (31) of theirs from this distance. However Mexico only conceded 7% (5) and Croatia 11% (9) of their goals in this way. Brazil conceded 7% (5) of their goals in the final 15 minutes of matches, while Mexico scored 35% (4) of theirs in this period. Croatia scored 43% (1) of their goals from inside the 6 yard box, while Mexico conceded 29% (24) of theirs from this distance. Mexico scored 32% (7) of their goals from inside the 6 yard box, while Croatia conceded 56% (31) of theirs from this distance. Mexico scored 16% (7) of their goals from corners, while Cameroon conceded 50% (31) of theirs in this way Group B – Spain, Chile, Australia, Netherlands Australia scored 56% (3) of their goals from the wings, but their group opponents conceded the 3 lowest proportions from these areas: Spain 0% (1), Netherlands 20% (2), Chile 24% (3). Chile scored 17% (6) of their goals from corners, but none of their group opponents conceded any corners in qualifying. Spain scored 71% (2) of their goals from central areas, while Chile conceded 64% (27) of theirs from these positions. Australia scored 52% (2) of their goals in the final 15 minutes of matches, while Spain conceded 100% (32) of theirs in this period. Netherlands took 93% (5) of possible points from winning positions, while Chile took 0% (28) of theirs from losing positions. Group C – Colombia, Ivory Coast, Japan, Greece Japan scored 30% (7) of their goals from headers, while Greece conceded 50% (30) of theirs in this way. Colombia took 85% (25) of possible points from winning positions, but Ivory Coast took 56% (5) from losing positions and Greece took 50% (8). Ivory Coast scored 26% (1) of their goals in the first 15 minutes of matches, but Greece conceded 0% (1) of theirs in this period. Greece scored 19% (7) of their goals from outside the penalty area, while Colombia conceded 23% (25) of theirs from this range. Colombia scored 19% (5) of their goals from free kicks, while Greece conceded 50% (31) of theirs in this way Ivory Coast took 56% (5) of possible points from losing positions, while Colombia took 85% (25) of theirs from winning ones Group D – Uruguay, Italy, Costa Rica, England England scored 19% (6) of their goals from outside the penalty area, while Italy conceded 33% (29) of theirs from this distance. England scored 26% (5) of their goals from their left flank, while Italy conceded 44% (32) of theirs in from this area. England scored 13% (7) of their goals in the first 15 minutes of matches, while Uruguay conceded 20% (24) of theirs in this way England scored 48% (8) of their goals from the wings, while Costa Rica conceded 58% (24) of theirs from these areas. England conceded 50% (28) of their goals from set pieces, but Uruguay scored 33% (3) of theirs in this way England conceded 25% (23) of their goals from headers, but Italy scored 42% (2) of theirs in this way England conceded 25% (23) of their goals from headers, but Costa Rica scored 33% (4) of theirs in this way Costa Rica scored 33% (4) of their goals from headers, while Italy conceded 33% (26) of theirs in this way. Costa Rica scored 22% (8) of their goals from their left flank, while Italy conceded 44% (32) of theirs in this way. Italy took 50% (8) of possible points from losing positions, while Uruguay took 82% (30) of theirs from winning ones. Italy scored 16% (4) of their goals from long balls, while Costa Rica conceded 17% (30) of theirs in this way. Uruguay conceded 20% (24) of their goals in the first 15 minutes of matches, and all of their group opponents scored among the 7 highest proportions of goals in this period: Costa Rica 22% (2), Italy 16% (5), England 13% (7) Group E – Switzerland, Ecuador, Honduras, France Switzerland scored 24% (7) of their goals from their left flank, while Ecuador conceded 38% (28) of theirs from this area. Ecuador scored 20% (2) of their goals from free kicks, but Switzerland conceded 0% (1) of theirs in this way. Honduras scored 28% (7) of their goals in the final 15 minutes of matches, while Switzerland conceded 50% (27) of theirs in this way. Honduras failed to score in 38% (32) of their matches and France in 30% (30), while Switzerland kept a clean sheet in 70% (1) of theirs Ecuador scored 35% (5) of their goals from inside the 6 yard box, while Honduras conceded 33% (25) of theirs from this distance Group F – Argentina, Nigeria, Iran, Bosnia Argentina scored 77% (1) of their goals from central

The 2014 World Cup: Teams Stats Read More »

The 2014 World Cup Draw: In detail

There’s always national pride at stake and it’s displayed in various ways: the economy, politics, governance, etc. there’s bigger pride displayed when it comes to football and what better place to display the pride than the FIFA World Cup which commences in June next year in the electrifying, colouful and vibrant nation of Brazil. Brazil is no stranger to football and that’s the perfect venue to display national pride. The draw for the competition comes up on December 6, 2013 by 5pm (Nigerian time) at the luxurious beach resort Costa do Sauípe in Mata de São João, Bahia, Brazil. It is 76km away from host city Salavador, the Capital of the state of Bahia. Since it’s in a Luxurious Hotel, you would expect it to be lavished and that is just about going to happen. It’s going to be hosted by Brazilian Actress and Actor Fernanda Lima and Rodrigo Hilbert and will see performances by Brazilian music artistes Alexandre Pires, Vanessa da Mata and Deborah Colker. They will be joined by Emicida, Alcione, Margareth Menezes and the percussion group Olodum. The balls will be drawn by famous players from previous tournaments. These will include England’s 1966 final hat-trick hero Sir Geoff Hurst, France’s Zinedine Zidane, Brazil’s Cafu and Italy’s Fabio Cannavaro. The draw which will be a global TV extravaganza broadcast live in over 170 countries will be done in a mammoth white tent, more of an aircraft hangar which has been erected on the beach sand. At 9,000 square meters in area, it is bigger than most of the world’s cathedrals. It is carpeted inside, so the high heels and smart shoes of the 1,300 guests shouldn’t make any noise. It is air conditioned against Brazil’s summer heat and powered by mobile generators. And all this will have to be dismantled, packed up and trucked out after Friday’s 90-minute show. The whole cost of this big event goes at a staggering US$11 million. That figure kind of sums up why many of Brazil’s poor protested during the Confederations Cup back in June. Too much money is lavished on these projects and they are not getting a dime of the money. That’s the irony of life but it can be sure the event won’t be a flop. In preparation for the final draw, the 32 qualified teams have been organised into four pots based on seedings and geographic regions. It was announced in October 2013 that the eight seeded teams to feature in Pot 1 would consist of the host nation Brazil and the seven highest-ranked teams as of that month’s FIFA World Rankings. Following a meeting of the competition’s organising committee on 3 December the composition of the other three pots were announced: Pot 1 (Seeds) Pot 2 (Africa & South America) Pot 3 (Asia & North America) Pot 4 (Europe)  Brazil(hosts)  Argentina  Colombia  Uruguay  Belgium  Germany  Spain   Switzerland Algeria  Cameroon  Ivory Coast  Ghana  Nigeria  Chile  Ecuador  Australia  Japan  Iran  South Korea  Costa Rica  Honduras  Mexico  United States   Bosnia & Herzegovina  Croatia  England  France  Greece  Italy  Netherlands  Portugal  Russia The draw procedure coined out from wikipedia will be as follows: One European team will first be randomly drawn from Pot 4 and placed into Pot 2, in order to create four even pots of eight teams. The draw will then proceed with the drawing of the other seven seeded teams from Pot 1 into Groups B–H, with Brazil having been predetermined to be in Group A. To maximise geographic separation, an ancillary pot (“Pot X”) will be created during the draw procedure into which the four seeded South American teams (from Pot 1) will be placed. One of these four teams will be drawn out. The sole European team from Pot 2 will then be automatically placed into the group of the South American team that was drawn from “Pot X”. This will prevent three European teams being grouped together. All remaining teams will then be drawn sequentially from the pots (i.e. Pots 2, 3, then 4) into the groups in alphabetical order (i.e. Group A, then Group B etc). During the drawing of Pot 2, groups may be skipped over as the two South American teams in Pot 2 may not be drawn into the (remaining three) groups headed by South American seeds. The positions within the eight groups will then be drawn for the non-seeded teams, in order to determine the order of the fixtures within each group. The eight seeded teams are automatically designated the position of Team 1 within their group (i.e. Brazil will be A1). This draw procedure listed above sounds complicated and confusing, but it doesn’t take away the fact that on the mark of 90 minutes tomorrow, all 32 teams represented by their delegates will know their fate. There will be happy and sad faces by the outcome of the draw, but the whole drama doesn’t take away the excitement that is beginning to build on the greatest football show on the planet come June 12 to July 13, 2014.  

The 2014 World Cup Draw: In detail Read More »

subscribe to our newsletter

stay up to date with the latest content

Subscription Form

Scroll to Top